14. Lab: Guitar Alchemist in 3D, fifteen measured experiments
Sections
Reading settings
No voice for this language in this browser.
More voices
Code and English terms
Off: the page’s voice reads everything, with no pause between two voices.
No voice for this language in this browser.
More voices
More voices: Microsoft Edge has natural online voices, and Windows (Settings › Time & language › Speech), macOS and Android install others.
Code: code/threejs/ga-lab: one page per experiment, the runner scripts/run.mjs, the shared timing code src/lab.ts, the committed hypotheses in experiments/ and every measurement in results/.
Purpose
Section titled “Purpose”Lessons 1 to 13 taught three.js and ported GuitarAlchemist’s neck. This lesson asks the questions GA’s 3D code will meet next, and answers them by measurement rather than by rule of thumb: how to draw many necks, how to animate strings, how to pick among 10,000 notes, how to show 313,047 voicings, what textures, shadows and bloom cost, how a physics engine and a headset treat a real-size guitar, and what happens on a weak GPU.
Every experiment follows the same protocol. Its JSON file in experiments/ holds a question, a hypothesis and numeric predictions, written and committed on 16 September 2026, before the measured run. The run wrote results/<experiment>/results.json on 17 September. The verdicts below compare the two, and the predictions that failed stay in the tables: they are most of what this lab taught.
How the measurements were made
Section titled “How the measurements were made”Machine. Windows 11 Pro 10.0.26200, Intel Core Ultra 9 285K, 64 GB, one enabled GPU, an NVIDIA GeForce RTX 5080 (driver 610.88), Chromium 153.0.8010.12 from Playwright 1.63.0, Node.js 24.12, three.js r186. Every results.json repeats these facts.
Frames. A page doesn’t use requestAnimationFrame: it renders frame after frame in a loop, with Chromium started with --disable-gpu-vsync and --disable-frame-rate-limit, so the display never paces it. Each page renders at a fixed size, and WebGPU and WebGL 2 are compared at the same size. After 30 warm-up frames, 240 frames are timed (fewer where noted), and the tables give medians:
- CPU ms: the page’s frame function, which includes
renderer.render()recording and submitting the commands; - GPU ms: the durations of the frame’s render and compute passes from timestamp queries (WebGPU’s
timestamp-queryfeature, orEXT_disjoint_timer_query_webgl2on WebGL 2); - wall ms: the CPU time plus the wait until the GPU queue is done (
GPUQueue.onSubmittedWorkDone()on WebGPU, a 1-pixelreadPixels()on WebGL 2).
On WebGPU the wall time never went under about 3.5 ms, whatever the scene: that is the delay of onSubmittedWorkDone() in this Chromium, not GPU work. The GPU column is the one to read for GPU cost, and the wall time only when it rises above that floor.
Counters. renderer.info is reset by each frame, not by render(), so a frame’s counters add up all its passes. WebGPURenderer counts its output pass (tone mapping to the canvas) as one draw call: a scene of one mesh reports 2.
Run it. From code/threejs, after npm ci and npx playwright install chromium chromium-headless-shell:
node ga-lab/scripts/optick-project.ts # the OPTIC-K projection (--synthetic 20000 without GA's index)node ga-lab/scripts/wood-texture.ts # the wood PNG; ga-lab/scripts/wood-ktx2.sh compresses it with KTX-Softwarenode ga-lab/scripts/guitar-body.ts # the glTF body and its levels of detailnode ga-lab/scripts/run.mjs 01-neck # one experiment, or allnode ga-lab/scripts/run.mjs 01-neck --run merged-16npx vite --config ga-lab/vite.config.ts # the pages, at http://localhost:5288/01-neck.html?strategy=merged&necks=16The commands are the same on Windows (Git Bash), Linux and macOS; wood-ktx2.sh needs Bash and the ktx tool of KTX-Software 4.4.2. The measured numbers belong to this machine: yours will differ, the ratios less.
CI. threejs-ga-lab.yml runs ga-lab/check.sh on Ubuntu, Windows and macOS: type-checking, the unit tests, the data scripts, every experiment’s short ci runs on WebGL 2, whose renderer.info counters and checks are compared with expected/, and the build. It compares no time: the runners have no GPU.
1. The neck four ways
Section titled “1. The neck four ways”Hypothesis. Draw calls drive a frame’s CPU time; the GPU time barely moves, since every strategy draws about the same triangles.
Setup. 01-neck draws the neck with the C major chord, 1200 × 400 CSS pixels at a pixel ratio of 1, in four ways: ga, lesson 13’s reproduction of GA’s structure (one mesh per fret, inlay, string, label and marker); instanced, lesson 13’s port (one InstancedMesh per kind); batched, one BatchedMesh; merged, all static parts merged into one geometry with vertex colors, and the markers instanced. For 16 necks, ga and instanced mount 16 copies.
| Strategy | Draw calls, 1 neck | CPU ms, 1 neck | Draw calls, 16 necks | CPU ms, 16 necks | GPU ms, 16 necks |
|---|---|---|---|---|---|
| ga | 72 | 0.715 | 1,137 | 2.910 | 0.134 |
| instanced | 7 | 0.405 | 97 | 1.155 | 0.026 |
| batched | 44 | 0.385 | 689 | 0.415 | 0.023 |
| merged | 4 | 0.315 | 19 | 0.360 | 0.025 |
GA’s pixel ratio of 3 against 1, one neck: 0.040 against 0.017 GPU ms. On WebGL 2, the same ga neck took 0.590 CPU ms and 1.435 wall ms.
| Prediction | Measured | Verdict |
|---|---|---|
| Draw calls ga 72, instanced 7, batched and merged 4 or fewer | 72, 7, 44, 4 | batched wrong |
| CPU, ga at least 3x merged; all under 2 ms | 2.3x; all under 1 ms | wrong, second part right |
| CPU, 16 necks: ga at least 10 ms; batched and merged under 1.5 ms | 2.9 ms; 0.42 and 0.36 ms | wrong, second part right |
| GPU, 16 necks: the four within 30% | ga 5x the others | wrong |
| Pixel ratio 3 against 1: GPU at least 4x | 2.4x | wrong |

What it means for GA. The RTX 5080 is too fast for one neck to show a cost: GA’s 72 draw calls take 0.7 ms of CPU. What grows is the count of objects: 16 necks in GA’s structure take 8 times the CPU of the merged necks, and 5 times the GPU time, since each draw call has a fixed cost on the GPU as well. BatchedMesh on WebGPU drew one call per object (44), where WebGL 2 with the WEBGL_multi_draw extension drew 3 in CI: on r186’s WebGPU backend it saves CPU work, not draw calls. And the port of lesson 13, instanced per neck, creates its materials per neck: 97 draw calls and 73 programs for 16 necks, where merging keeps 19 and 8. A screen with several necks should share materials between Fretboard3D instances or merge the static parts.
2. A vibrating string three ways
Section titled “2. A vibrating string three ways”Hypothesis. With 6 strings, CPU vertices, TSL and morph targets are indistinguishable; with 600, rewriting vertices costs CPU time and an upload each frame, while TSL and morph targets cost almost nothing on the CPU.
Setup. 02-string-vibration draws strings of 429 vertices at their real gauge and displaces them sideways with a damped fundamental, the same formula in the three methods: rewriting the position attribute (cpu), a TSL positionNode (tsl, lesson 13’s choice), or a morph target of the full-amplitude shape with a per-instance influence (morph). Each frame is a fixed instant, so that the images can be compared.
| Method | CPU ms, 6 | CPU ms, 600 | GPU ms, 600 |
|---|---|---|---|
| cpu | 0.405 | 1.800 | 0.030 |
| tsl | 0.355 | 0.360 | 0.051 |
| morph | 0.375 | 0.465 | 0.035 |
| Prediction | Measured | Verdict |
|---|---|---|
| 6 strings: the three within 0.3 ms | within 0.05 ms | right |
| 600 strings: cpu at least 5x tsl; morph within 2x tsl | 5.0x; 1.3x | right |
| 600 strings: GPU within 30% | tsl 1.7x cpu | wrong |
| Pixels differing between cpu and tsl, 6 strings: under 0.5% | 0 pixels (morph against tsl: 0; 600 strings: 0 and 1) | right |
What it means for GA. Lesson 13’s TSL strings are the right choice for CPU time, and they cost a little more GPU time than displaced vertices, since the displacement is computed per vertex per frame instead of uploaded: still 0.05 ms for 600 strings. Morph targets on an InstancedMesh needed two fixes, reported below: in r186 their target must be marked morphTargetsRelative, or the base mesh shrinks with the influence, and an InstancedMesh of a single instance fails without morphTargetInfluences, while one of several instances fails with them.
3. Picking one note among 10,000
Section titled “3. Picking one note among 10,000”Hypothesis. Raycaster tests every instance on the CPU and grows with the note count; a GPU ID pass costs a readback that doesn’t. At 10,000 notes the GPU pick is faster.
Setup. 03-picking lays out notes as small icosahedra of 80 triangles in one InstancedMesh, and picks 200 fixed pseudo-random points twice: with Raycaster.intersectObject, and by rendering a 1 × 1 pixel view (camera.setViewOffset) of the instances colored by instanceIndex + 1 into a render target, read back with readRenderTargetPixelsAsync.
| Notes | Raycaster ms per pick | GPU ID pass ms per pick | Agreement |
|---|---|---|---|
| 1,000 | 0.070 | 3.000 | 200/200 |
| 10,000 | 0.465 | 3.395 | 200/200 |
| 100,000 | 4.475 | 3.925 | 200/200 |
| 10,000, WebGL 2 | 0.495 | 16.925 | 200/200 |
| Prediction | Measured | Verdict |
|---|---|---|
| Raycaster, 10,000 notes: 3 to 8 ms | 0.465 ms | wrong |
| GPU ID pass, 10,000 notes, WebGPU: 1 to 3 ms | 3.4 ms | wrong, just above |
| Agreement at least 98% | 100% | right |
| Raycaster, 1,000 notes: under a quarter of 10,000 | 15% | right |
What it means for GA. Keep Raycaster for a fretboard: even 10,000 notes take half a millisecond, seven times less than the GPU readback, which pays for a round trip to the GPU whatever the count. The two meet around 100,000 notes. On WebGL 2 the readback took 17 ms, one frame: an ID pass there would make every click wait a frame.
4. Pitch-class bracelets, transposed on the CPU or in TSL
Section titled “4. Pitch-class bracelets, transposed on the CPU or in TSL”Hypothesis. Transposing 4,096 bracelets on the CPU pays for 49,152 matrices and their upload each frame; in TSL it uploads one number.
Setup. 04-bracelet draws every pitch-class set as a ring of 12 beads, lit for its members, and rotates every ring by a transposition step that changes each frame: by writing the InstancedMesh’s matrices (cpu), or with a step uniform in a positionNode over per-bead attributes (tsl). The set arithmetic is in pcs.ts, with unit tests.
| Bracelets | CPU ms, cpu | CPU ms, tsl | GPU ms, cpu | GPU ms, tsl |
|---|---|---|---|---|
| 352 | 0.495 | 0.335 | 0.103 | 0.102 |
| 4,096 | 2.455 | 0.290 | 1.012 | 1.024 |
| Prediction | Measured | Verdict |
|---|---|---|
| CPU path, 4,096: at least 4 ms | 2.5 ms | wrong |
| TSL path, 4,096: under 0.5 ms | 0.3 ms | right |
| GPU within 30% | within 1% | right |
| Pixels differing between the paths: under 1% | 0 pixels, for 352 and for 4,096 | right |
| Classes under transposition, and with inversion: 352 and 224 | 352 and 224 (unit test) | right |
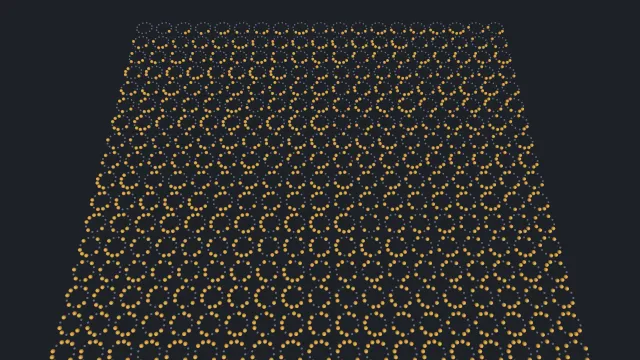
What it means for GA. An animation that moves every instance the same way belongs in the shader: 8 times less CPU for the 4,096 sets. For the 352 transposition classes that a GA view would show, both paths stay under half a millisecond.
5. The OPTIC-K voicing cloud, up to 1,000,000 points
Section titled “5. The OPTIC-K voicing cloud, up to 1,000,000 points”Hypothesis. One-pixel points stay cheap up to 1,000,000; octahedra fall behind; animating 1,000,000 points on the CPU is limited by the loop and the upload, which a compute shader removes.
Setup. scripts/optick-project.ts opens GA’s real OPTIC-K index read-only, in the OPTK version 4 layout of OptickIndexReader.cs: 313,047 voicings (297,910 guitar, 7,795 bass, 7,342 ukulele) of 124 dimensions, not the 112 that the experiment’s question assumed. A principal component analysis of 62,610 of them gives two 3D projections, components 1 to 3 (23.4% of the variance) and 4 to 6 (14.5%), in 1.3 s. 05-optick-cloud draws them at 1280 × 720 as Points, as instanced octahedra, and blends one projection into the other each frame on the CPU or in a compute shader. Beyond 313,047 points it repeats the voicings with a small offset.
| Run | CPU ms | GPU ms | Wall ms |
|---|---|---|---|
| Points, 1,000 | 0.330 | 0.013 | 3.595 |
| Points, 313,000 | 0.260 | 0.067 | 3.365 |
| Points, 1,000,000 | 0.300 | 0.173 | 3.565 |
| Octahedra, 1,000,000 | 0.300 | 3.753 | 5.690 |
| CPU morph, 1,000,000 | 4.055 | 0.170 | 9.430 |
| Compute morph, 1,000,000 | 0.335 | 0.511 | 3.580 |
| Compute morph, 1,000,000, WebGL 2 | 0.280 | 2.785 | 3.490 |
| Prediction | Measured | Verdict |
|---|---|---|
| Points, 1,000,000: GPU under 3 ms | 0.17 ms | right |
| Octahedra, 1,000,000: at least 5x Points | 22x | right |
| CPU morph, 1,000,000: CPU at least 8 ms | 4.1 ms (wall 9.4 ms) | wrong |
| Compute morph, 1,000,000: CPU under 1 ms | 0.34 ms | right |
| Compute doesn’t run on WebGL 2 | it runs: 2 compute calls, 2.8 GPU ms | wrong |
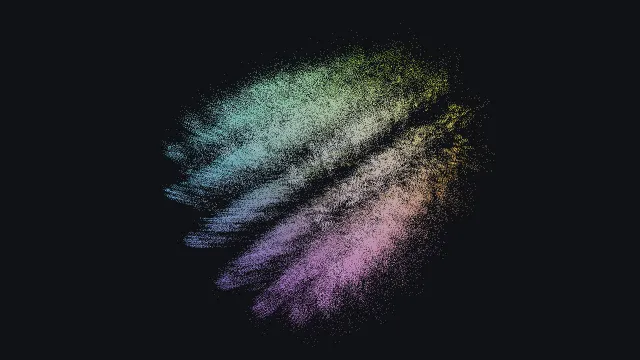
What it means for GA. All of GA’s voicings fit in one draw call of points at 0.07 GPU ms, and a 1,000,000-point morph in a compute shader costs half a millisecond. r186 runs TSL compute on WebGL 2 too, by transform feedback, at 5 times the GPU time: a compute-based view doesn’t have to fall back to the CPU on machines without WebGPU. The first two principal components hold less than a quarter of the variance: the cloud’s shape is a view, not a map of distances, and a nearest-neighbor answer must come from the index, not from the picture.
6. Fretboard wood: textures, KTX2 and a procedural wood
Section titled “6. Fretboard wood: textures, KTX2 and a procedural wood”Hypothesis. A 2048 × 2048 RGBA8 texture with mipmaps holds about 22 MB; compressed to KTX2 (BC7 on this GPU) a quarter; a procedural wood holds nothing but costs noise per pixel.
Setup. 06-wood-textures fills a 1920 × 1080 frame with the board, seen from above, textured with a 2048 × 2048 wood PNG from wood-texture.ts (1,217,318 bytes), the same compressed by KTX-Software 4.4.2 to UASTC with zstd (1,018,936 bytes) and to Basis LZ (145,002 bytes), a TSL wood made of mx_noise_float, or a flat color. The ComfyUI woods (the ComfyUI GA lab’s experiment 4) didn’t exist when this ran: that run is pending. Texture memory is renderer.info.memory.texturesSize minus the flat run’s 23.73 MB, which are the render targets.
| Run | Texture MB | GPU ms |
|---|---|---|
| PNG | 21.33 | 0.052 |
| KTX2 UASTC, transcoded to BC7 (format 36492), 12 mip levels | 0 counted | 0.050 |
| KTX2 Basis LZ, transcoded to BC7 | 0 counted | 0.049 |
| Procedural TSL | 0 | 0.116 |
| Flat color | 0 | 0.038 |
| ComfyUI | pending | pending |
| Prediction | Measured | Verdict |
|---|---|---|
| RGBA8 with mipmaps: about 22 MB | 21.33 MB | right |
| KTX2 in BC7: about 5.6 MB | not measurable: renderer.info counts 0 bytes for compressed textures |
not measured |
| Procedural at least 2x the texture’s GPU time | 2.2x | right |
| ComfyUI textures pending | pending | right |
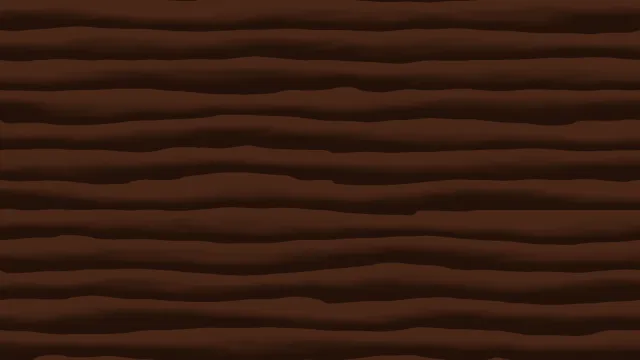
What it means for GA. Basis LZ ships the wood in 145 kB instead of 1.2 MB, and becomes BC7 on this GPU, 1 byte per texel, about 5.6 MB with mipmaps by calculation (to verify with a GPU memory tool, since renderer.info doesn’t count it). The procedural wood costs 0.06 ms more per 1080p frame and no download at all. Both are cheaper than the PNG in memory.
7. A PBR grid for strings and frets
Section titled “7. A PBR grid for strings and frets”Hypothesis. Materials of one type with different values share one program; MeshPhysicalMaterial adds programs and shading work.
Setup. 07-pbr-grid draws 36 spheres at 1920 × 1080, metalness growing from left to right and roughness from top to bottom, under a RoomEnvironment through PMREM: 36 MeshStandardMaterials, one shared, or 36 MeshPhysicalMaterials with GA’s clearcoat 0.35 and sheen 0.3.
| Run | Programs | Compile ms | GPU ms |
|---|---|---|---|
| 36 standard | 16 | 206 | 0.059 |
| 1 standard, shared | 16 | 198 | 0.058 |
| 36 physical | 16 | 299 | 0.086 |
| Prediction | Measured | Verdict |
|---|---|---|
| 36 standard materials: as many programs as 1 | 16 and 16 | right |
| Physical at least 1.3x standard’s GPU time | 1.46x | right |
| Frets read as polished nickel at metalness 1, roughness 0.2 to 0.35 | judged on the screenshot, not measured | not measured |
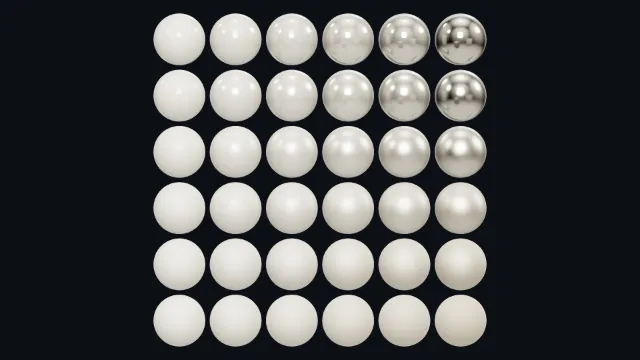
What it means for GA. Different metalness and roughness values don’t multiply programs: they are uniforms. Programs come from the material’s type and features, so GA’s clearcoat and sheen cost shading time, not compilation. The 16 programs of a one-sphere-type scene are the renderer’s own: environment, PMREM and output passes.
8. Shadows under the strings
Section titled “8. Shadows under the strings”Hypothesis. A dynamic shadow map doubles the casters’ draw calls; rendering it once costs nothing per frame; a baked texture costs a CPU bake; a contact shadow costs a pass and a blur.
Setup. 08-shadows renders the neck at 1920 × 1080 with a directional light’s shadow map (1024, 2048 and 4096 texels, updated each frame or once), an ambient occlusion texture baked on the CPU by casting 16 rays per texel of a 512 × 128 grid, or a contact shadow: an orthographic view from above of the parts above the board into a 512 × 128 render target, blurred with 25 taps in TSL.
| Run | Draw calls | GPU ms | One-time cost |
|---|---|---|---|
| None | 8 | 0.046 | |
| Shadow map 1024 | 13 | 0.051 | |
| Shadow map 4096 | 13 | 0.051 | |
| Shadow map rendered once | 13, then 8 | 0.046 | |
| Baked AO | 8 | 0.046 | 398 ms bake |
| Contact shadow | 14 | 0.068 |
| Prediction | Measured | Verdict |
|---|---|---|
| Shadow map: about 2x the draw calls | 13 against 8, 1.6x | roughly right |
| 4096 against 1024: at most 1.5x GPU time | 1.0x | right |
| Rendered once: after the first frame, the draw calls of none | 8 | right |
| Bake: 100 to 500 ms | 398 ms | right |
| Contact shadow: under +0.5 ms GPU | +0.022 ms | right |
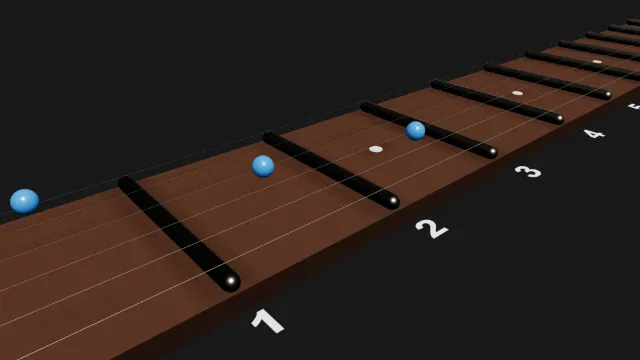
What it means for GA. A neck’s shadow map draws few triangles, so its size barely matters on this GPU; the choice is about memory and sharpness. A static neck should render its shadow once (shadow.autoUpdate = false), and a baked texture removes even that, for 0.4 s at load.
9. Bloom on active notes
Section titled “9. Bloom on active notes”Hypothesis. Bloom adds a fixed chain of about 10 to 12 passes whose cost follows the resolution; selective bloom adds a color attachment.
Setup. 09-bloom renders the neck at 1920 × 1080 with the markers’ emissive intensity at 4, without bloom, with bloom() on the whole image at full and half resolution, and on an emissive MRT output only (selective).
| Run | Draw calls | Render targets | GPU ms |
|---|---|---|---|
| None | 7 | 1 | 0.034 |
| Full | 19 | 12 | 0.169 |
| Half resolution | 19 | 12 | 0.106 |
| Selective (MRT) | 19 | 12 | 0.191 |
| Prediction | Measured | Verdict |
|---|---|---|
| Bloom adds about 10 to 12 draw calls | 12 | right |
| Bloom adds 0.5 to 1.5 GPU ms at 1080p | +0.135 ms | wrong |
| Selective within +20% of full | +13% | right |
| Half resolution: at most 0.6x the added time | 0.53x | right |
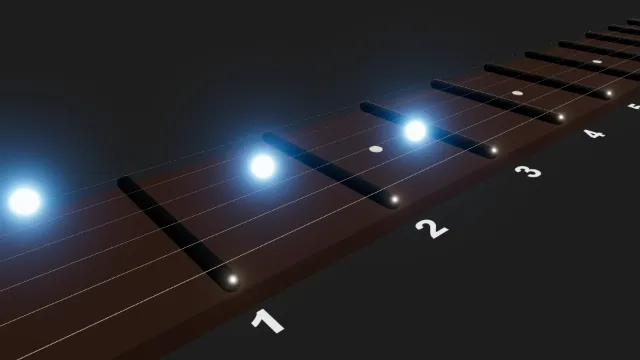
What it means for GA. Bloom on active notes costs 0.14 ms per 1080p frame on this GPU, four times less than predicted, and selective bloom through MRT costs about the same as bloom on everything, while leaving the wood and the frets unblurred.
10. A wall of guitars: LOD and culling
Section titled “10. A wall of guitars: LOD and culling”Hypothesis. Most of 1,000 bodies are far or outside the view: LOD divides the triangles by 10, and turning culling off draws all of them.
Setup. guitar-body.ts builds a guitar body procedurally, extrudes it, and simplifies it with meshoptimizer into a glTF file of three levels: 14,360, 3,590 and 718 triangles. 10-lod-culling hangs 1,000 of them on a wall, walks the camera along it, and averages the counters over the 240 frames of the path.
| Run | Draw calls, path average | Triangles, path average | CPU ms | GPU ms |
|---|---|---|---|---|
| Full detail, culling on | 334 | 4,780,804 | 0.970 | 0.210 |
| LOD, culling on | 334 | 428,091 | 2.365 | 0.068 |
| Full detail, culling off | 1,001 | 14,360,001 | 1.560 | 0.607 |
| LOD, culling off | 1,001 | 1,326,075 | 3.450 | 0.139 |
| Prediction | Measured | Verdict |
|---|---|---|
| LOD: at most 1/10 of the triangles | 1/11.2 | right |
| Culling off: at least 2x the draw calls | 3x | right |
| LOD: at most 1/3 of the GPU time | 0.32 | right |
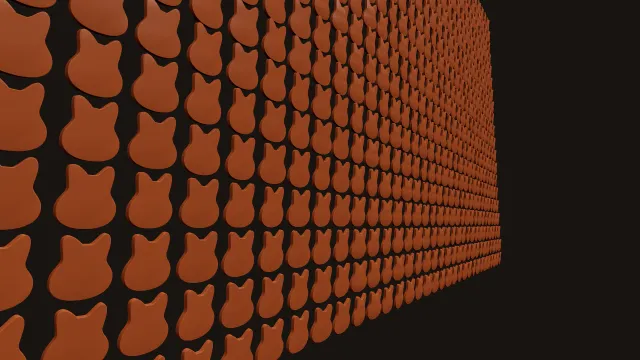
What it means for GA. LOD pays on the GPU and costs on the CPU: THREE.LOD measures every body’s distance each frame, 2.4 times the CPU time here. With a few guitars on screen, it isn’t worth it; for a gallery of hundreds, it is.
11. Rapier: a pick striking a string
Section titled “11. Rapier: a pick striking a string”Hypothesis. Without continuous collision detection (CCD), a pick moving 33 mm per step at 1/60 s passes through a 0.5 mm string; CCD prevents it; the joints stretch less as the step shrinks.
Setup. e11-rapier-pick.ts runs Rapier 0.20 (deterministic build) in Node.js: a string of 64 capsules of 10 mm joined by spherical joints between the nut and the bridge, and a kinematic pick crossing it at 2 m/s, at 30 to 960 steps per second, with CCD off, on the pick, or on the string.
| Steps per second | Pick travel per step | Contact | String moved | Largest stretch | CPU ms per simulated second |
|---|---|---|---|---|---|
| 30 | 66.7 mm | no | no | 0% | 9.5 |
| 60 | 33.3 mm | yes | no | 0% | 14.0 |
| 120 | 16.7 mm | yes | yes | 33.6% | 43.1 |
| 240 | 8.3 mm | yes | yes | 24.0% | 65.3 |
| 480 | 4.2 mm | yes | yes | 12.9% | 111.2 |
| 960 | 2.1 mm | yes | yes | 7.3% | 204.0 |
These are the runs with CCD off; with CCD on the pick or on the string, the contacts were the same at every rate, and the stretch within a few points.
| Prediction | Measured | Verdict |
|---|---|---|
| CCD off: passes through at 1/30 and 1/60 s, not at 1/480 s | yes, yes (a contact event at 1/60, the string doesn’t move), no | right |
| CCD on: never passes through | passes through at 1/30 and 1/60 s | wrong |
| Stretch at 1/240 s: under 1% | 24% | wrong |
| At 1/30 s: over 5% stretch or NaN | no contact at all, nothing moves | wrong |
| CPU time proportional to steps, within 30% | 0.21 to 0.36 ms per step | roughly right |
What it means for GA. Rapier’s CCD applies to dynamic bodies; a kinematic pick moved by setting its next position doesn’t benefit from it, and neither does a string hit by it. A pick needs at least 120 steps per second to touch a string, and a chain of joints stretches by a quarter at 240: a playable string is better modeled as a spring equation (experiment 2’s formula), with Rapier only detecting the strike.
12. WebXR at 1:1
Section titled “12. WebXR at 1:1”Hypothesis. This machine has no headset; under IWER’s emulation, the nut to 12th fret distance is 0.324 m.
Setup. 12-webxr-scale scales the neck to meters (one unit is 10 mm), asks for a hardware immersive-vr session, then starts one on IWER’s emulated Meta Quest 3, as lesson 11 did.
| Measure | Value |
|---|---|
| Hardware session | could not run: isSessionSupported("immersive-vr") is false |
| Emulated session | presenting, features local-floor, viewer, local |
| Views per XR frame | 2, 63 mm apart |
| Nut to 12th fret in the reference space | 0.324 m, scale length 0.648 m |
| Head position given, then reported | (−0.1, 1.55, 0.45), then (−0.1, 1.5751, 0.4751) |
| Prediction | Measured | Verdict |
|---|---|---|
| Hardware: could not run | could not run | right |
| Nut to 12th fret: 0.324 m within 1 mm | 0.324 m | right |
| 2 views per frame | 2 | right |
What it means for GA. A real-size neck is a matter of units, and the emulator confirms it; how it feels in a hand is to verify on a headset. The emulated head was reported 25 mm higher and further than given, an offset of IWER’s pose (to verify) that a calibration step would have to absorb.
13. WebAudio and the string’s vibration
Section titled “13. WebAudio and the string’s vibration”Hypothesis. A vibration started on the click’s frame shows before the sound leaves the speakers by baseLatency plus outputLatency; scheduling from getOutputTimestamp() brings the gap under one frame.
Setup. 13-audio-sync plucks a string 20 times, with a silent gain, with Chromium’s frame pacing on (60 Hz), and measures how early the first vibrating frame comes before the note’s audible time, starting it at once (naive) or at the time AudioContext.getOutputTimestamp() maps the note to (compensated). It ran headless and headed.
| Run | baseLatency | outputLatency | Frame | Naive lead | Compensated lead |
|---|---|---|---|---|---|
| Headless | 10 ms | 40 ms | 16.66 ms | 31.0 ms | −2.3 ms |
| Headed | 10 ms | 40 ms | 16.66 ms | 31.8 ms | −1.5 ms |
| Prediction | Measured | Verdict |
|---|---|---|
| baseLatency + outputLatency, headed: 20 to 60 ms | 50 ms | right |
| Naive lead: that sum within one frame | 31.8 ms, 18 ms short | wrong, just |
| Compensated lead: under 17 ms | 1.5 ms | right |
| Headless: outputLatency 0 or no device | the same 10 and 40 ms | wrong |
What it means for GA. Without compensation, the string moves about 30 ms, two frames, before the note is heard: noticeable on a fast strum. Delaying the visual start to the output timestamp removes it. The latencies are what Chromium reports for the default device, not an acoustic measurement: a microphone test is to verify.
14. React Three Fiber against vanilla
Section titled “14. React Three Fiber against vanilla”Hypothesis. R3F’s per-frame cost is small next to renderer.render(); its cost is at startup and in the bundle.
Setup. 14-r3f-vs-vanilla loads either lesson 13’s Fretboard3D in a Canvas driven by advance(), or the same instanced objects built without React, each with a dynamic import, from the Vite dev server. bundle-sizes.mjs builds each module alone for production.
| Measure | R3F | Vanilla |
|---|---|---|
| CPU ms per frame | 0.400 | 0.355 |
| First frame since navigation (dev server) | 958 ms | 528 ms |
| JavaScript heap after the frames | 36.96 MB | 26.98 MB |
| Draw calls, triangles | 7, 11,919 | 7, 11,919 |
| Production bundle, gzip | 565 kB | 210 kB |
| Of which not three.js | 195 kB | 2 kB |
| Prediction | Measured | Verdict |
|---|---|---|
| CPU per frame: R3F under +0.3 ms | +0.045 ms | right |
| First frame: R3F +30 to 150 ms | +430 ms (dev server) | wrong |
| Bundle without three.js: R3F +50 to 90 kB gzip | +193 kB | wrong |
| Equal draw calls | 7 and 7 | right |
What it means for GA. R3F costs nothing per frame. It costs at load: 430 ms on the dev server (to verify on a production build) and 10 MB of heap. Its bundle also brought three.js twice: R3F imports three, the WebGL build (three.module.js, 89 kB gzip), next to three/webgpu, and the R3F build weighed 565 kB against 210. An alias of three to three/webgpu in Vite’s configuration should remove the duplicate (to verify).
15. A weak GPU
Section titled “15. A weak GPU”Hypothesis. GPU time follows the pixel count, so a pixel ratio of 3 costs about 9 times 1 on a weak GPU; powerPreference changes nothing on a machine with one adapter; an adaptive controller settles within 60 frames.
Setup. 15-weak-gpu draws the instanced neck at 1200 × 400 CSS pixels, on the RTX 5080 and in chromium-headless-shell, which has no WebGPU adapter and falls back to WebGL 2 on SwiftShader, Chromium’s CPU rasterizer, standing in for a weak GPU. The adaptive controller starts at a pixel ratio of 2 and, every 10 frames, multiplies it by 0.8 when the median wall time exceeds 95% of 16.7 ms, or by 1.1 under 60%, between 0.5 and 2.
| Pixel ratio | RTX 5080 GPU ms | SwiftShader wall ms |
|---|---|---|
| 0.5 | 9.0 | |
| 1 | 0.014 | 26.7 |
| 2 | 95.4 | |
| 3 | 0.037 | 208.2 |
Adaptive controller on SwiftShader, pixel ratio at each check: 2 (111.5 ms), 1.6 (74.6 ms), 1.28 (47.7 ms), 1.024 (31.2 ms), 0.819 (20.6 ms), 0.655 (14.5 ms), then 0.655 until frame 120. On the RTX 5080 it stayed at 2, with medians of 3.5 to 4.3 ms.
| Prediction | Measured | Verdict |
|---|---|---|
| SwiftShader, ratio 3 against 1: at least 5x | 7.8x | right |
low-power and high-performance: the same RTX 5080 |
the same, and Chromium warns that the option is ignored on Windows | right |
| Controller after 60 frames: RTX 2; SwiftShader 1 or lower | 2; 0.655 | right |
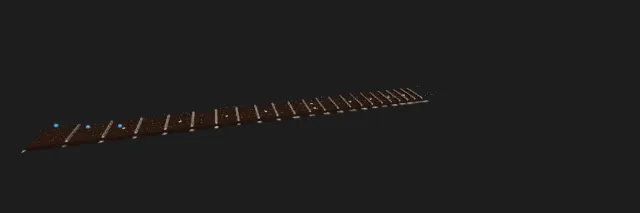
What it means for GA. GA’s pixel ratio of 3 makes a neck 208 ms per frame on a software rasterizer, and a controller settling on 0.655 brings it to 60 frames per second in 60 frames. powerPreference can’t pick a GPU on Windows: the operating system’s graphics settings do (to verify on a laptop with two GPUs).
What the lab found in three.js r186
Section titled “What the lab found in three.js r186”InstancedMeshwith morph targets: with one instance, the morph node readsmorphTargetInfluences, whichInstancedMeshdoesn’t create, and fails onnull; with several, setting them fails inUniformArrayNode.updateBuffer. A morph target of displacements also needsgeometry.morphTargetsRelative = true.BatchedMeshdraws one call per object on the WebGPU backend (44 for one neck), and 3 on WebGL 2 withWEBGL_multi_draw.- TSL compute runs on the WebGL 2 backend.
renderer.info.memory.texturesSizecounts 0 bytes for compressed textures, and includes render targets.GPUQueue.onSubmittedWorkDone()doesn’t resolve sooner than about 3.5 ms in Chromium 153 on Windows, which puts a floor under any wall time measured with it.
Key takeaways
Section titled “Key takeaways”- Write the prediction before the run: 19 of this lab’s 61 predictions were wrong in whole or in part, several by a factor, 2 couldn’t be measured, and the wrong ones changed the advice.
- On a fast GPU, one neck costs nothing; object counts, pixel ratio and load time are what grow.
- Keep
Raycasterfor a fretboard, and TSL for animations that move every instance. - GA’s whole OPTIC-K index is one draw call of points; a compute shader animates a million of them, even on WebGL 2.
- KTX2 Basis LZ divides the wood’s download by 8;
renderer.infocan’t tell you its GPU memory. - A kinematic pick passes through a string whatever CCD says: detect the strike, simulate the string with a formula.
- Compensate audio latency with
getOutputTimestamp(), and cap the pixel ratio with a controller, not a constant.
Exercises
Section titled “Exercises”- Share materials between 16
Fretboard3Dnecks and predict the draw calls and programs before measuring withrun.mjs 01-neck --run instanced-16. - Prove the GPU ID pass’s floor: run experiment 3 with 1,000,000 notes. Predict both pick times first.
- Add a
vite.config.tsalias ofthreetothree/webgpufor the R3F build and rerunbundle-sizes.mjs. How much should disappear? - Why did the adaptive controller settle at 0.655 and not at 0.8? Compute the ratio at which SwiftShader would take 15.9 ms, from the fixed-ratio table.
- Explain why CCD on the pick didn’t stop it at 60 steps per second, and change
e11-rapier-pick.tsso that it does. - The experiment 13 prediction for the naive lead missed by 18 ms. What does the naive lead measure that the latency sum doesn’t?
Solution 1
The 16 necks have 97 draw calls and 73 programs because each neck creates its own materials and label texture. With one set of materials and one texture for all necks, the renderer can’t merge draw calls between separate InstancedMeshes: the draw calls stay at 6 per neck plus the output pass, 97, while the programs should fall to about the 13 of one neck, and the textures to 4. To draw fewer calls, the necks would have to share each InstancedMesh (one instanced fret mesh for all necks), which is the merged strategy’s 19. A prediction, not a measured run (to verify).
Solution 2
Raycaster grew about linearly: 0.07, 0.465 and 4.475 ms for 1,000, 10,000 and 100,000 notes, so about 45 ms for 1,000,000. The ID pass went from 3.0 to 3.9 ms, while its render grew from 0.04 to 1.3 GPU ms: at 1,000,000 notes the 1-pixel render still draws every instance, about 13 ms of GPU, so about 16 ms per pick. The GPU pick should win by about 3 times. Run node ga-lab/scripts/run.mjs 03-picking after adding a run with notes=1000000; the numbers above are extrapolated (to verify).
Solution 3
In ga-lab/vite.config.ts, resolve.alias with { find: /^three$/, replacement: 'three/webgpu' } makes R3F’s import * as THREE from 'three' load the WebGPU build. three.module.js (89 kB gzip) should leave the bundle, and the R3F total fall from 565 kB toward 476 kB. R3F 9 uses classes that both builds export, such as Vector3, Raycaster and Object3D, so it should keep working (to verify: run experiment 14 again and compare the draw calls).
Solution 4
The controller multiplies by 0.8 above 15.9 ms and by 1.1 under 10 ms. At 0.819 it measured 20.6 ms, above: 0.655. At 0.655 it measured 14.5 ms, between 10 and 15.9: it stays. Wall time is about proportional to the pixel count, the square of the ratio: 26.7 ms at 1 gives 15.9 ms at the square root of 15.9 / 26.7, 0.77. The controller can’t land there: from 0.819 its only step down is 0.655, and at 0.655 its 14.5 ms are above the 10 ms under which it would step up. Finer steps near the budget, or a ratio computed from the measured time (the current ratio times the square root of the budget over the time), would settle closer.
Solution 5
Rapier’s CCD sweeps a body’s motion between its position and the next one given by its velocity. A kinematic body moved with setNextKinematicTranslation has a motion, but CCD resolves penetrations for dynamic bodies, pushing them back along the sweep; it doesn’t stop a kinematic body, and a dynamic string segment of 10 mm isn’t swept against a pick that jumps 33 mm past it. Two ways that work: substep the pick’s motion (several world.step() calls with shorter moves per rendered frame), or cast the pick’s shape along its motion with world.castShape and apply an impulse to the segment it hits. A design, not code run (to verify).
Solution 6
The latency sum is how long the audio takes from the context’s clock to the speaker. The naive lead is measured between frames: the vibration shows on the next frame after the click, and the note’s output time is sampled at 60 Hz, so the lead is the latency minus the time until that frame is presented, up to one frame, and minus how far the audio clock had already advanced in its 10 ms render quantum. 50 ms minus a frame and a quantum is 23 to 33 ms: the 31.8 ms measured sits inside it. The prediction should have been “the sum minus up to one frame and one render quantum”.
Sources
Section titled “Sources”- three.js r186:
WebGPURenderer,BatchedMesh,InstancedMesh,LOD,KTX2Loader, TSL - W3C: WebGPU (
timestamp-query,GPUQueue.onSubmittedWorkDone(),GPURequestAdapterOptions.powerPreference), Web Audio API (baseLatency,outputLatency,getOutputTimestamp()), WebXR Device API - Khronos: KTX 2.0, KTX-Software 4.4.2,
EXT_disjoint_timer_query_webgl2 - Chromium: issue 369219127,
powerPreferenceignored on Windows - Rapier continuous collision detection; IWER; meshoptimizer; React Three Fiber
- GuitarAlchemist/ga at
66bdd04:OptickIndexReader.cs